JCOM1939 Monitor – User Manual V 1.01
JCOM1939 Monitor Pro/Pro-X
Windows Software to Monitor, Record, Analyze, and Simulate SAE J1939 Data Traffic
Copyright © 2020 Copperhill Technologies Corporation
https://copperhilltech.com
Introduction

The JCOM1939 Monitor Software is the perfect tool to monitor, record, analyze, and simulate SAE J1939 data traffic. The system works in combination with our SAE J1939 gateways.
This comprehensive and easy-to-use, easy-to-understand Windows software displays not only SAE J1939 data traffic; it also allows to scan the network, simulate an ECU (incl. full node address negotiation features), and respond to data requests messages.
The communication protocol between the gateway and the host system (PC, Embedded System, Android System, etc.) is well documented, and we provide C/C# source code to read and write CAN data frames.
Features (Pro, Pro-X)
- FREE download
- ECU Simulation Setup (Preferred Node Address, Negotiable Address Range, NAME, and more)
- Filter J1939 PGNs for Display
- Design J1939 PGNs for Transmission (Data and Request Messages)
- Design J1939 PGNs for Request Responses
- Simulate Digital and Analog Signals
- Scan a J1939 Network (Number of Nodes, Node IDs, NAMEs)
- Record SAE J1939 Data Traffic
- Simulate SAE J1939 Data Traffic
- Check Gateway Status (Error Messages, Software/Hardware Version)
- Set Gateway Parameters (Heartbeat Frequency, Message Acknowledgment)
- Free Updates
Extended Features (Pro-X Only
- SAE J1939 Data Display and Recording Includes Timestamp
- PGN Filter Setup Includes a Sample Frequency
- SAE J1939 Data Recording to Micro SD Card Independent from PC Connection
- Recorded SAE J1939 Data Transfer to PC – In Preparation
The extended features are explained in chapter JCOM1939 Monitor Pro-X – Extensions &Modifications.
SAE J1939 Gateways
The JCOM1939 Monitor software versions work directly with the following SAE J1939 gateways:
JCOM1939 Monitor Pro
- SAE J1939 ECU Simulator Board with USB Port
- JCOM.J1939 Starter Kit and Network Simulator
- SAE J1939 to Bluetooth Gateway with 9-Pin Deutsch Connection Cable
- SAE J1939 to RS232 & USB Gateway with 9-Pin Deutsch Connection Cable
JCOM1939 Monitor Pro-X
- SAE J1939 Gateway Module with USB Port, RTC, MicroSD Memory Card
- SAE J1939 Gateway and Data Logger with Real-Time Clock
Main Screen
When you run the Windows software for the first time, you need to first select the COM port that relates to the J1939 Gateway. In the Windows Device Manager look for and select “Ports (COM & LPT)”. If the driver was installed successfully, you will see “Silicon Labs CP210x USB to UART Bridge” followed by the COM port associated with it. This is the port you must select in the Windows software. Should the software not show that particular COM port, please try again after rebooting the computer.
Also, it is mandatory that the simulator hardware is connected to a J1939 network. The simulator cannot send or monitor any data without being connected to a network.
The jCOM1939 Monitor software for Windows contains three main areas:
- On top, you will find the COM port section where you select the port number associated with your USB port. Click on Start COM to initiate the connection to the J1939 gateway. When the connection is made, you will see the Heartbeat bar changing in a one-second interval. If the heartbeat does not change, please check that you have selected the correct COM port number and that you have a connection with the gateway. If this does not help, try rebooting your computer.
- The next section is divided through several tabs such as ECU Setup, Filter, Transmit, Network, and Gateway. They are explained in the following chapters.
- The bottom section shows the SAE J1939 data as it is received or transmitted through the gateway.
In general, you can save the complete current setup to a file or load an existing file by using the File menu items.
Switching the CAN Baud Rate
The JCOM1939 Monitor program allows the switching of the CAN baud rate between 250k and 500k.
Use the selector in the top right-hand corner of the screen to select the baud rate. The default is 250k.
Please be aware that switching the baud rate requires the program to switch to mere monitoring mode (in case you already acquired a node address).
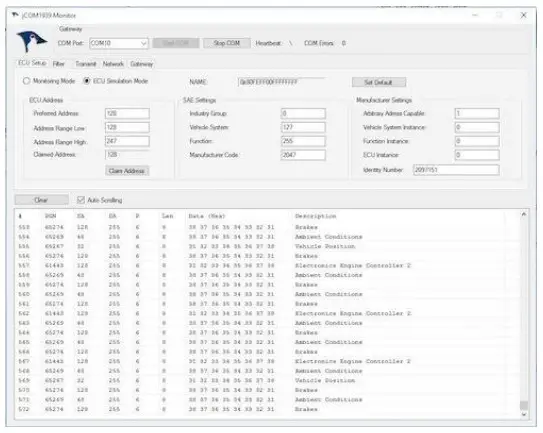
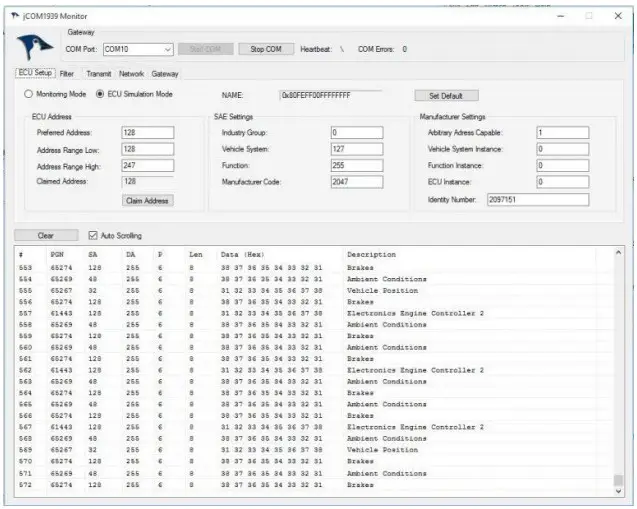
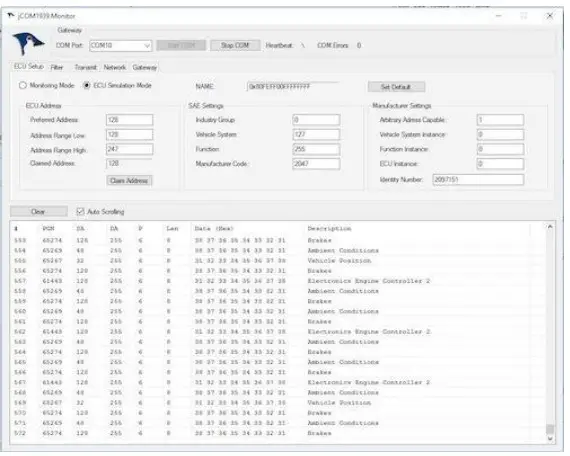
Data Display
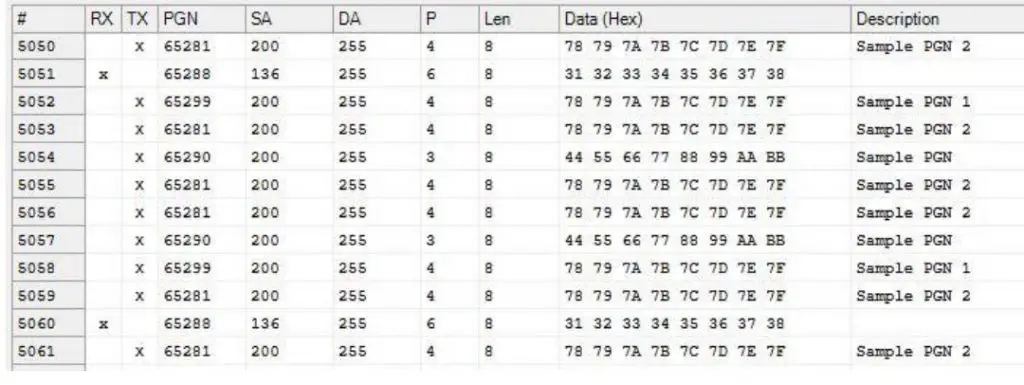
As you can gather from the previous image, the program lists all received PGNs according to the PGN filter settings. The displayed information includes:
- PGN Index
- PGN
- Source Address – SA
- Destination Address – DA
- Priority
- Message Length
- Data
- Description (assigned in PGN filter settings as described below)
As of Version 3.11.00, the data display has been extended to indicate whether the SAE J1939 data frame has been received or transmitted:
![]()
Special Case: Transport Protocol (TP
Please be aware that the displayed priority will be 255 when a data frame of more than 8 bytes was received (TP – Transport Protocol). The Transport Protocol itself uses a Priority = 7 but it does not transmit the priority of the original message.
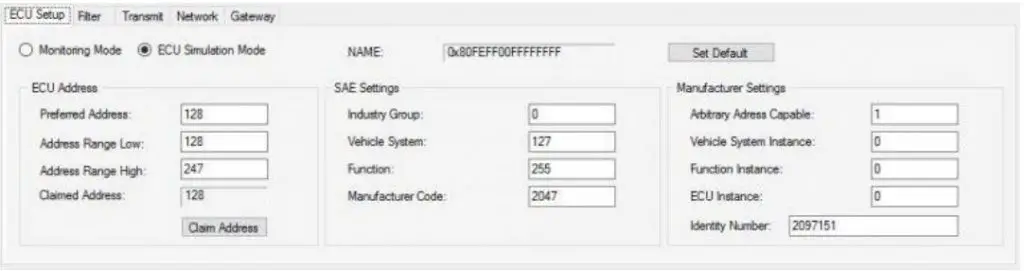
ECU Setup
If your intention is the mere monitoring of SAE J1939 data traffic, you don’t need to do anything here, but if you want to transmit SAE J1939 data (PGNs), you need to claim a node address.
This section is where you configure an SAE J1939 ECU through parameters such as Preferred Node Address, Negotiable Address Range, and the NAME setup. If you are not sure how to set the parameters, simply go with the default parameters. They are set up to have the ECU operate on the safe side without interfering with your J1939 network.
Don’t forget to click on ECU Simulation Mode and then the Claim Address command button before proceeding.
Filter Messages
The Filter section allows you to filter any PGNs (Parameter Group Numbers) from your network. Simply enter the PGN of your choice and a description (optional), then hit the Save command button. The PGN provided it is part of your J1939 data traffic will show on the data screen below. If you are not sure which PGN to filter, you can also click on the Pass All option. This will give you an overview of all PGNs in the network, and you can choose which one to filter.
In order to modify a specific PGN, simply click on it in the table. All parameters will appear in the editing section. Modify the parameters to your liking, then hit Save again.
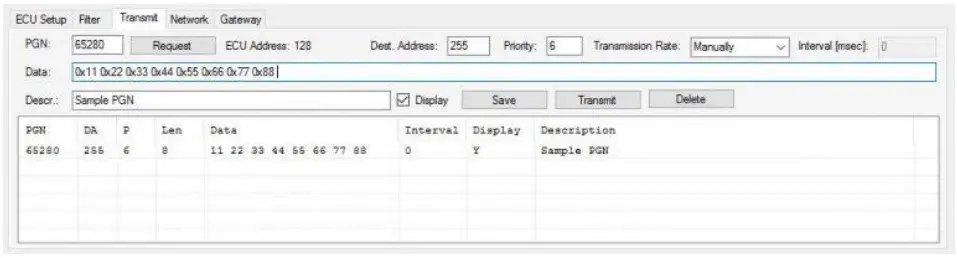
Transmit Messages
![]()
ease be aware that you can only transmit messages when you have chosen ECU Simulation Mode in the ECU Setup tab and you have claimed an ECU address (see paragraph ECU Setup above). Otherwise, the software will indicate that there is no node ID available. You can design messages by entering the PGN, Destination Address (255 = Global Address = Broadcasting), Priority, Data, Transmit Interval (optional), and Description (optional).
Click the Save command button to transfer the PGN into the Transmit table. If you have entered a transmission frequency, you will see the PGN appear in the Receive window below. For single (manual) transmission, leave the Interval at zero, select the PGN in the table and click on the Transmit command button.
In order to modify a specific PGN, simply click on it in the table. All parameters will appear in the editing section. Modify the parameters to your liking, then hit Save again.
Display Options
In cases where you set up PGN transmission at high frequencies (e.g., 10 milliseconds), it doesn’t make sense to display the message on the screen since the human eye will have problems following the data flow. Also, you will most likely miss other, received messages. For this case, the program offers a “Display” option.
To stress the point, checking the “Display” option for messages with a frequency of fewer than 100 milliseconds will put some burden on the communication with the PC, which should be avoided when possible.
In addition, it also offers a display mode affecting all transmitted PGNs by providing options such as Individual (as assigned through the “Display” option), Enables All, or Disable All.
Transmitting PGNs Using a Frequency
![]()
In case you want to transmit a PGN using a frequency, select the corresponding option in the “Transmission Rate” list box, then enter the frequency in milliseconds and click Save. The program will automatically send the PGN using the assigned frequency.
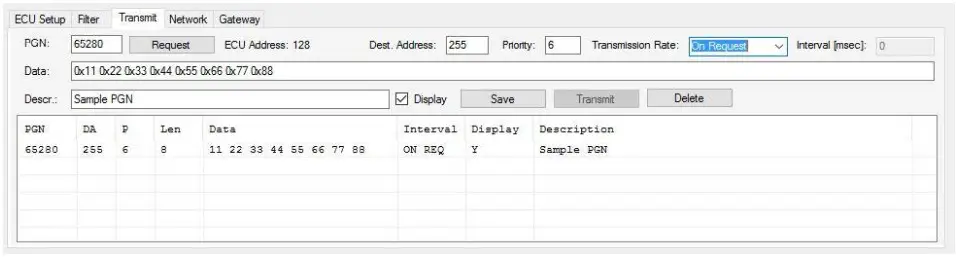
Transmitting PGNs Upon Request
![]()
In order to simulate an SAE J1939 ECU, it may be necessary to simulate the transmission of a PGN upon request. Edit the PGN as you would do with any regular PGN but select “On Request” in the “Transmission Rate” list box, then click Save. The message will be transmitted as soon as the program receives a request for it.
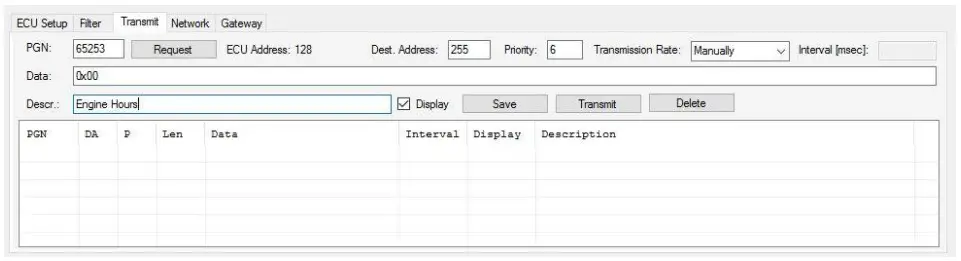
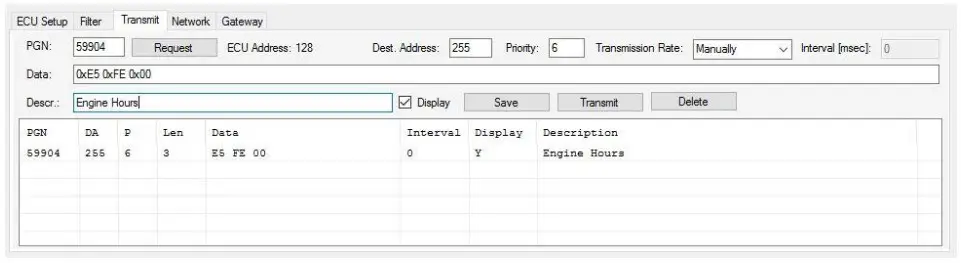
Setting Up a Request Message
A small set of PGNs is only available per Request message. In this example, we are setting up a request for “Engine Hours” – PGN 65253. Please note that you cannot set a frequency for request messages; the program will override any such entries. After editing the PGN, click on the Request command button (not the Save button).
The PGN for a Request message is 59904 and the data represents the requested PGN (LSB first, MSB last). All this reflects on the screen after hitting Request.
Transmitting Messages Longer Than 8 Bytes (TP – Transport Protocol)
The setup of a TP (Transport Protocol) message, i.e., a message with more than 8 data bytes, is identical to the process as described above, with the only exception that you cannot assign a transmit frequency since TP messages are only transmitted after a Message Request. The number of transmitted data can be between 9 and 1785 bytes.
The USB gateway will automatically manage the switching between regular PGNs (8 data bytes) and a TP transmission.
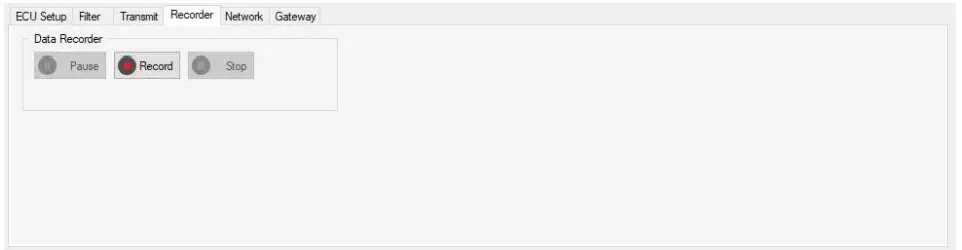
Data Recorder
The Recorder function allows the user to store received (filtered) PGNs into an MS-Excel-compatible CSV file.
Note: The JCOM1939 Monitor Pro-X version shows the tab as PC Recorder, in order to separate it from the second recording mode, the Gateway Recorder.
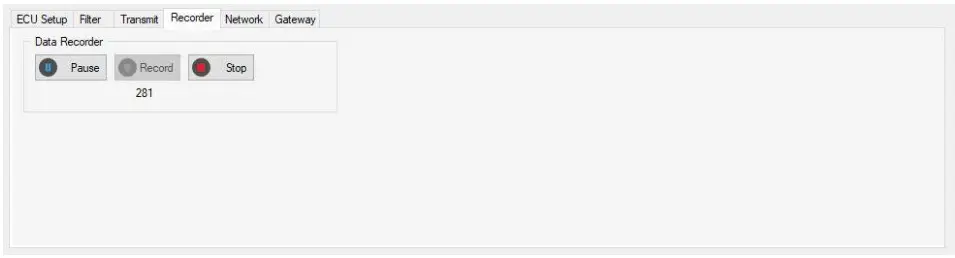
The control buttons are self-explanatory since they resemble those of any standard recording device. Click Record to start the recording process, and the program will display the number of urrent records as shown below.
After clicking the Stop button, the software will prompt you to store the file with a name and at a location of your choice.
The data format is .csv (comma-separated values), which can be viewed either per an ASCII text editor or Microsoft Excel.
Extensions
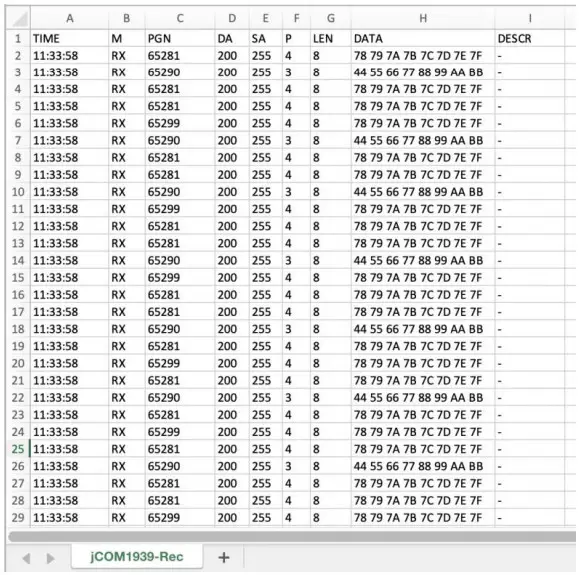
The JCOM gateways with Real-Time Clock (RTC) allow the storing of extended features, such as timestamp, reception mode (RX or TX), and PGN description:
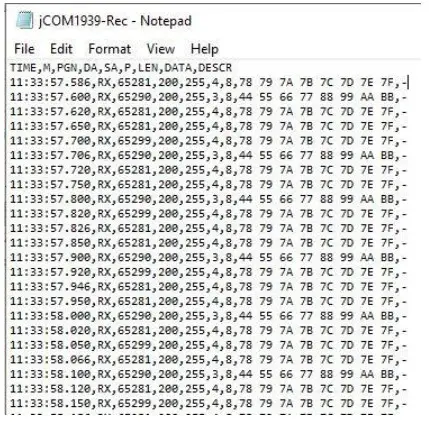
Note: The Time column in the Excel file view has been modified to display the data correctly. The Time column in the Excel file view has been modified to display the data correctly.
Network Scanner
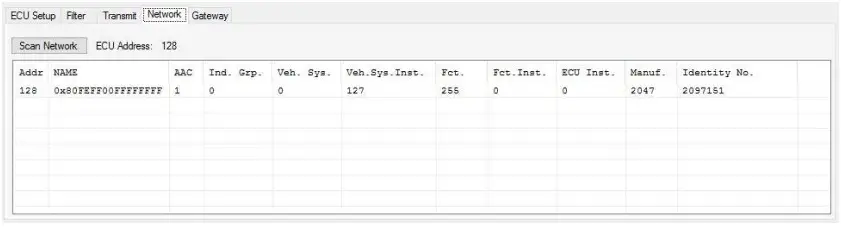
Please be aware that you can only scan the network when you have chosen ECU Simulation Mode in the ECU Setup tab. Otherwise, the software will indicate that there is no node ID available.
Click on the Scan Network command button, and the system will send a Request for Address Claimed message into the network. All other ECUs will respond and send their information, which will be displayed in the table.
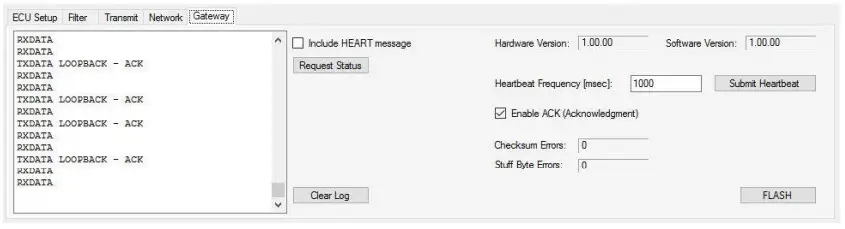
Gateway Modus
The Gateway Modus allows you to check the communication between your Windows computer nd the gateway. The information as displayed here is described in the manual for the JCOM1939 Protocol.
Note: The FLASH command button will set the gateway into programming mode, meaning it will cease its regular operation. The only way to resume regular operation is to reset the device per power cycle (off-on). This feature can be used to load firmware updates into the device. Please check with the product page on this website for possible updates.
Gateway Hardware and Firmware Version
The Gateway Modus section also displays the gateway’s hardware and firmware version, which helps to determine whether or not an update will be necessary.
In the upper right position of the tab, check the Software Version number and verify it with the newest version as documented as shown above on this page.
Note: For a detailed description of the firmware update procedure, please refer to the wiki section on our website dedicated to the JCOM gateway’s hardware. The firmware updating procedure is identical between devices but the reference to the firmware file will be different.
Byte and Bit Editing Mode
As of version 3.20.00, we have added two sections to the software that allows the comfortable editing of selected data bits and bytes, resembling digital and analog signals:
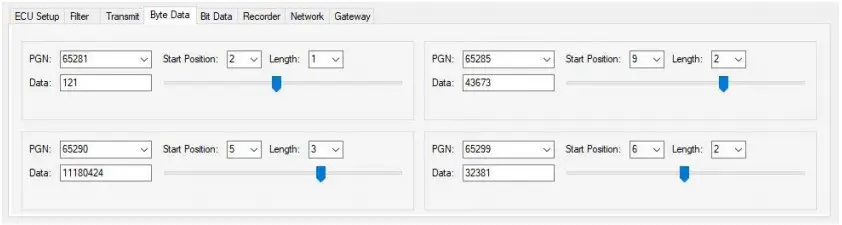
Byte Data Editing – Simulation of Analog Signals
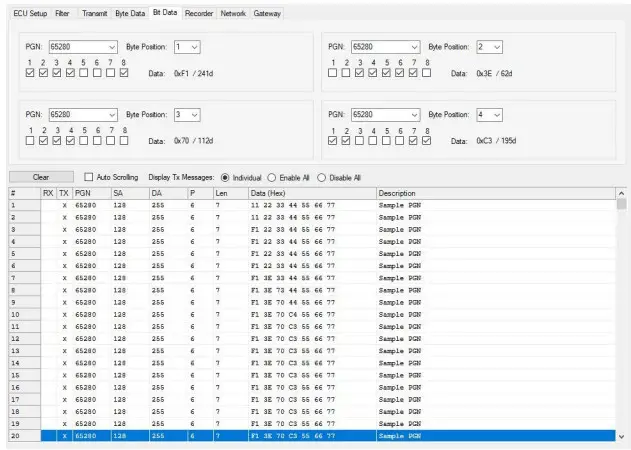
In the Byte Data section of the jCOM1939Monitor software, the user can select a previously designed PGN, the data start position, and the data length (1, 2, 3, or 4 bytes). The program will display the data as selected and allows the user to modify the data either per text input or sliding the associated track bar.
This mode was specifically designed with the simulation of analog signals in mind. However, due to the generic nature of the software, it does not verify that the selected PGN data represents an analog parameter. In the above sample, we chose a random selection of proprietary PGNs, and, while the screen shows four different PGNs, the program also allows the simultaneous modification of several bytes in the PGN data field.
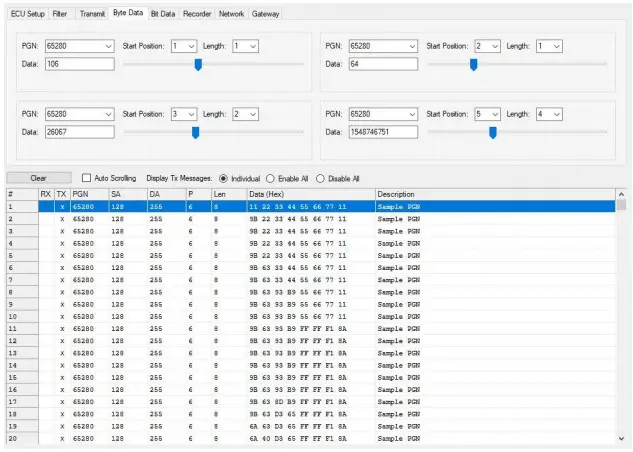
The following screenshot demonstrates how several bytes in one PGN were modified:
Note that the data is being updated and transmitted as soon as it is modified by the user.
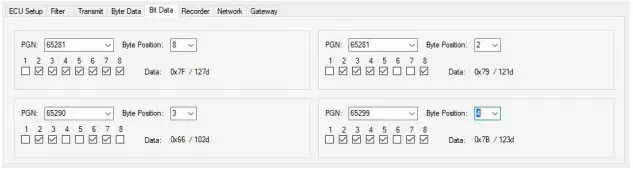
Bit Data Editing – Simulation of Digital Signals
The Bit Data section was designed with the modification of digital signals in mind. It functions very similarly to the Byte Data section, however, limited to one byte. Also, instead of a slider, the program uses checkboxes to set or reset digital information.
The following screenshot demonstrates how several bits in one PGN were modified:
JCOM1939 Monitor Pro-X – Extensions and Modifications
The following features are only supported by JCOM gateways with Real-Time Clock (RTC).
Note: Please make sure to check that your current JCOM1939 Monitor version and the gateway’s firmware version are up to date. Otherwise, there will be inconsistencies in functionality.
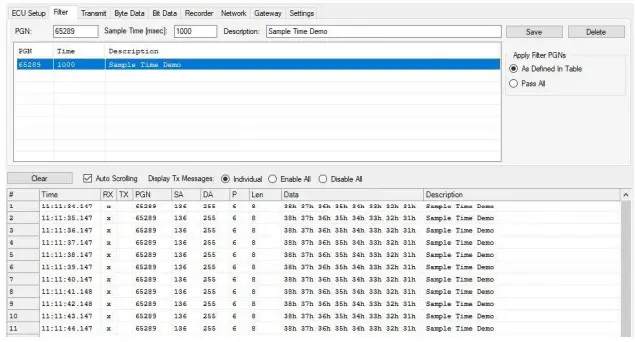
PGN Filters – Assigning a Sample Frequency
Starting with V 4.01.00 (Gateway firmware version 2.01.00), the JCOM1939 Monitor Pro-X
software, besides some slight design modifications, comes with an extended “Filter” section:
This new version allows editing a sample rate. Keeping the sample time at zero will result in realtime data reception, i.e., the original data rate.
In the screenshot above, we have assigned a sample rate of one second (1000 milliseconds) to PGN 65289 (we used a transmission ate of 50 milliseconds through our simulator).
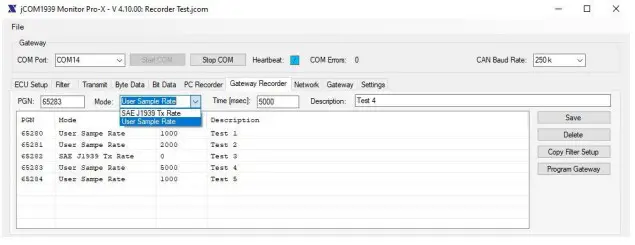
Gateway Recorder – J1939 Data Recording Programming
Starting with V 4.10.00 (Gateway firmware version 2.20.00), the onboard microSD card is being used to store SAE J1939 data traffic and to set up the recording configuration. For that purpose, the JCOM1939 Monitor software has been extended by the “Gateway Recorder” section, as shown in the following image:
The setup allows defining which PGN to record and which sample frequency to use. A sample frequency of zero indicates that the recorder should store the data immediately, i.e., according to the frequency defined by the SAE J1939 Standard.
This model assumes the recording of selected PGNs (message filtering) for diagnostics and analysis purposes. Depending on the number of PGNs, the maximum recording time can be between 4 to 12 weeks at 8 hours/day using a 16 GB microSD card.
Once the board is programmed (clicking the “Program Gateway” command button), the PC connection can be removed, and the gateway can be connected to a running SAE J1939 network (as simulated in our setup). Upon the next power-up cycle (Reset), the gateway will record the PGNs as defined in the setup without a PC connection.
The board will resume regular gateway operation as soon as it is re-connected to the PC running the JCOM1939 Monitor software.
Data Record Retrieval
At this time, data retrieval is accomplished by removing the SD card from the board and using a PC card reader.
For the purpose of improved data sampling and storage time, part of the real-time information, namely the date and hour of day, is integrated into the filename. This will reduce a great amount of redundant information.
Since the filename includes the recording date and hour, there will be one file per hour and a new file will be created at the beginning of a new hour (precision is plus/minus five seconds without loss of data).
Filename Format: DATAYYMMDDHH.txt
YY – Years since 2000
MM – Month
DD – Day
HH – Hour (0…23)
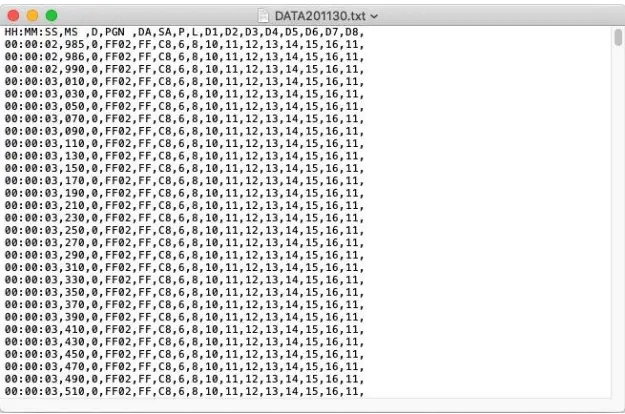
All information (data) is stored in ASCII text format, providing easy readability and adding basic means to verify data validity.
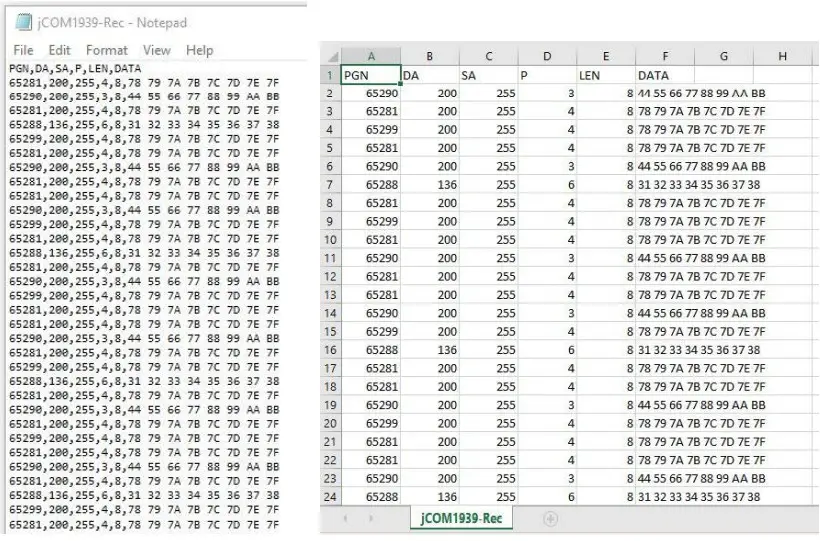
The file format is, however, MS-Excel-compatible. The screenshot below shows an example of one of our recording sessions.
Note: It almost appears that only PGN 65282 (FF02) is being recorded. However, this PGN is sampled at the highest frequency (20 msec). We checked, and the recording session does sample all PGNs as specified.
The data columns include time of day, milliseconds, Data Page, PGN, destination address (DA), source address (SA), and the data.
Note: We separated the milliseconds from the time of day to maintain a basic level of MS-ExcelCompatibility (Excel does not support time formatting down to milliseconds).
The next screenshot shows the same data as read by MS-Excel:
However, in order to create this view, we made a few modifications: We renamed the file from .txt to .csv to establish Excel compatibility. We formatted the time column (HH:MM: SS) according to the Excel format. Lastly, we formatted all columns to the left margin and adjusted the column width.
The test setup created text file sizes of 250MB per 24-hour recording session, which translates into roughly 48 days recording capacity at 24 hours per day using a 16GB SD card.